Adobe Kiosk Interface
Design a kiosk interface for Adobe event attendees to explore new features and learn how they can benefit the company by saving time and money.
Interaction | Animation | Prototyping
Company
Adobe
Team Breakdown
Product Manager, Engineer Lead, Project Manager, Marketing Director
Duration
2 months
Key Roles
Research, planning, concept design, prototyping, testing
Success Metrics
Over 50% visitors complete the end-to-end experience
Design Objective
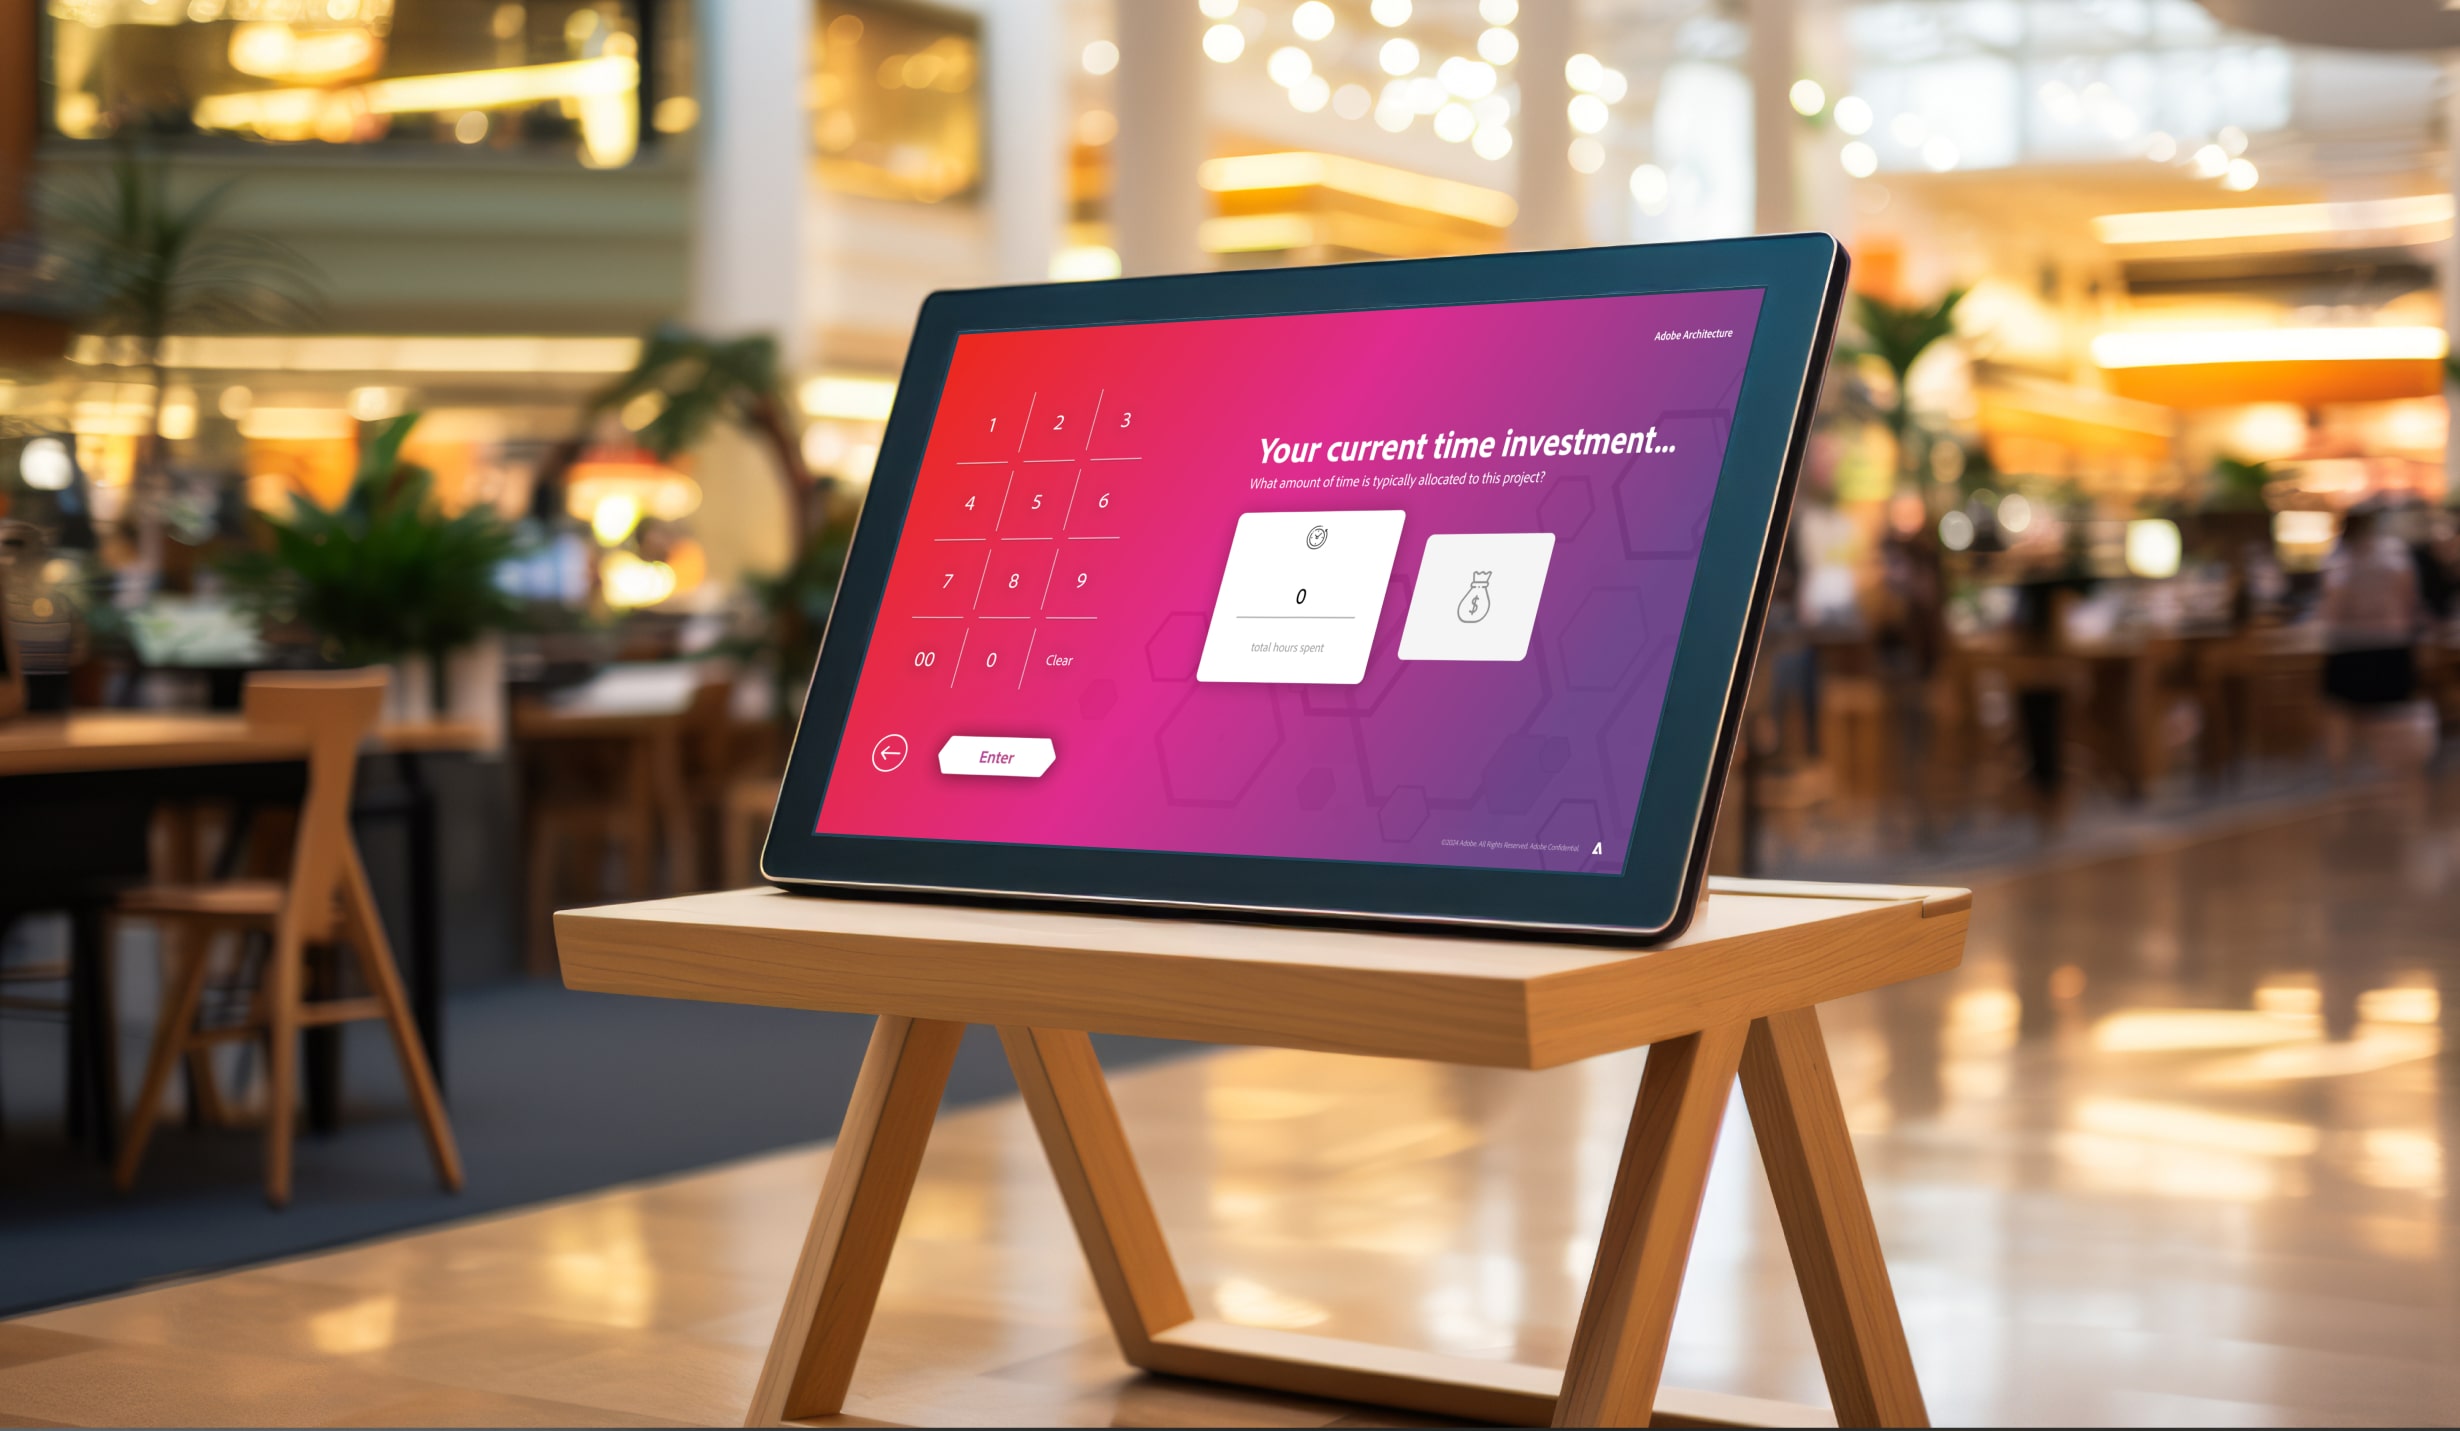
Adobe's marketing team needed to design a kiosk interface for its upcoming offline marketing event for new feature releases. The kiosk was set up to be a greeting station for all business representatives to preview new features and learn how much ROI (money or time) those features could potentially save for the company.
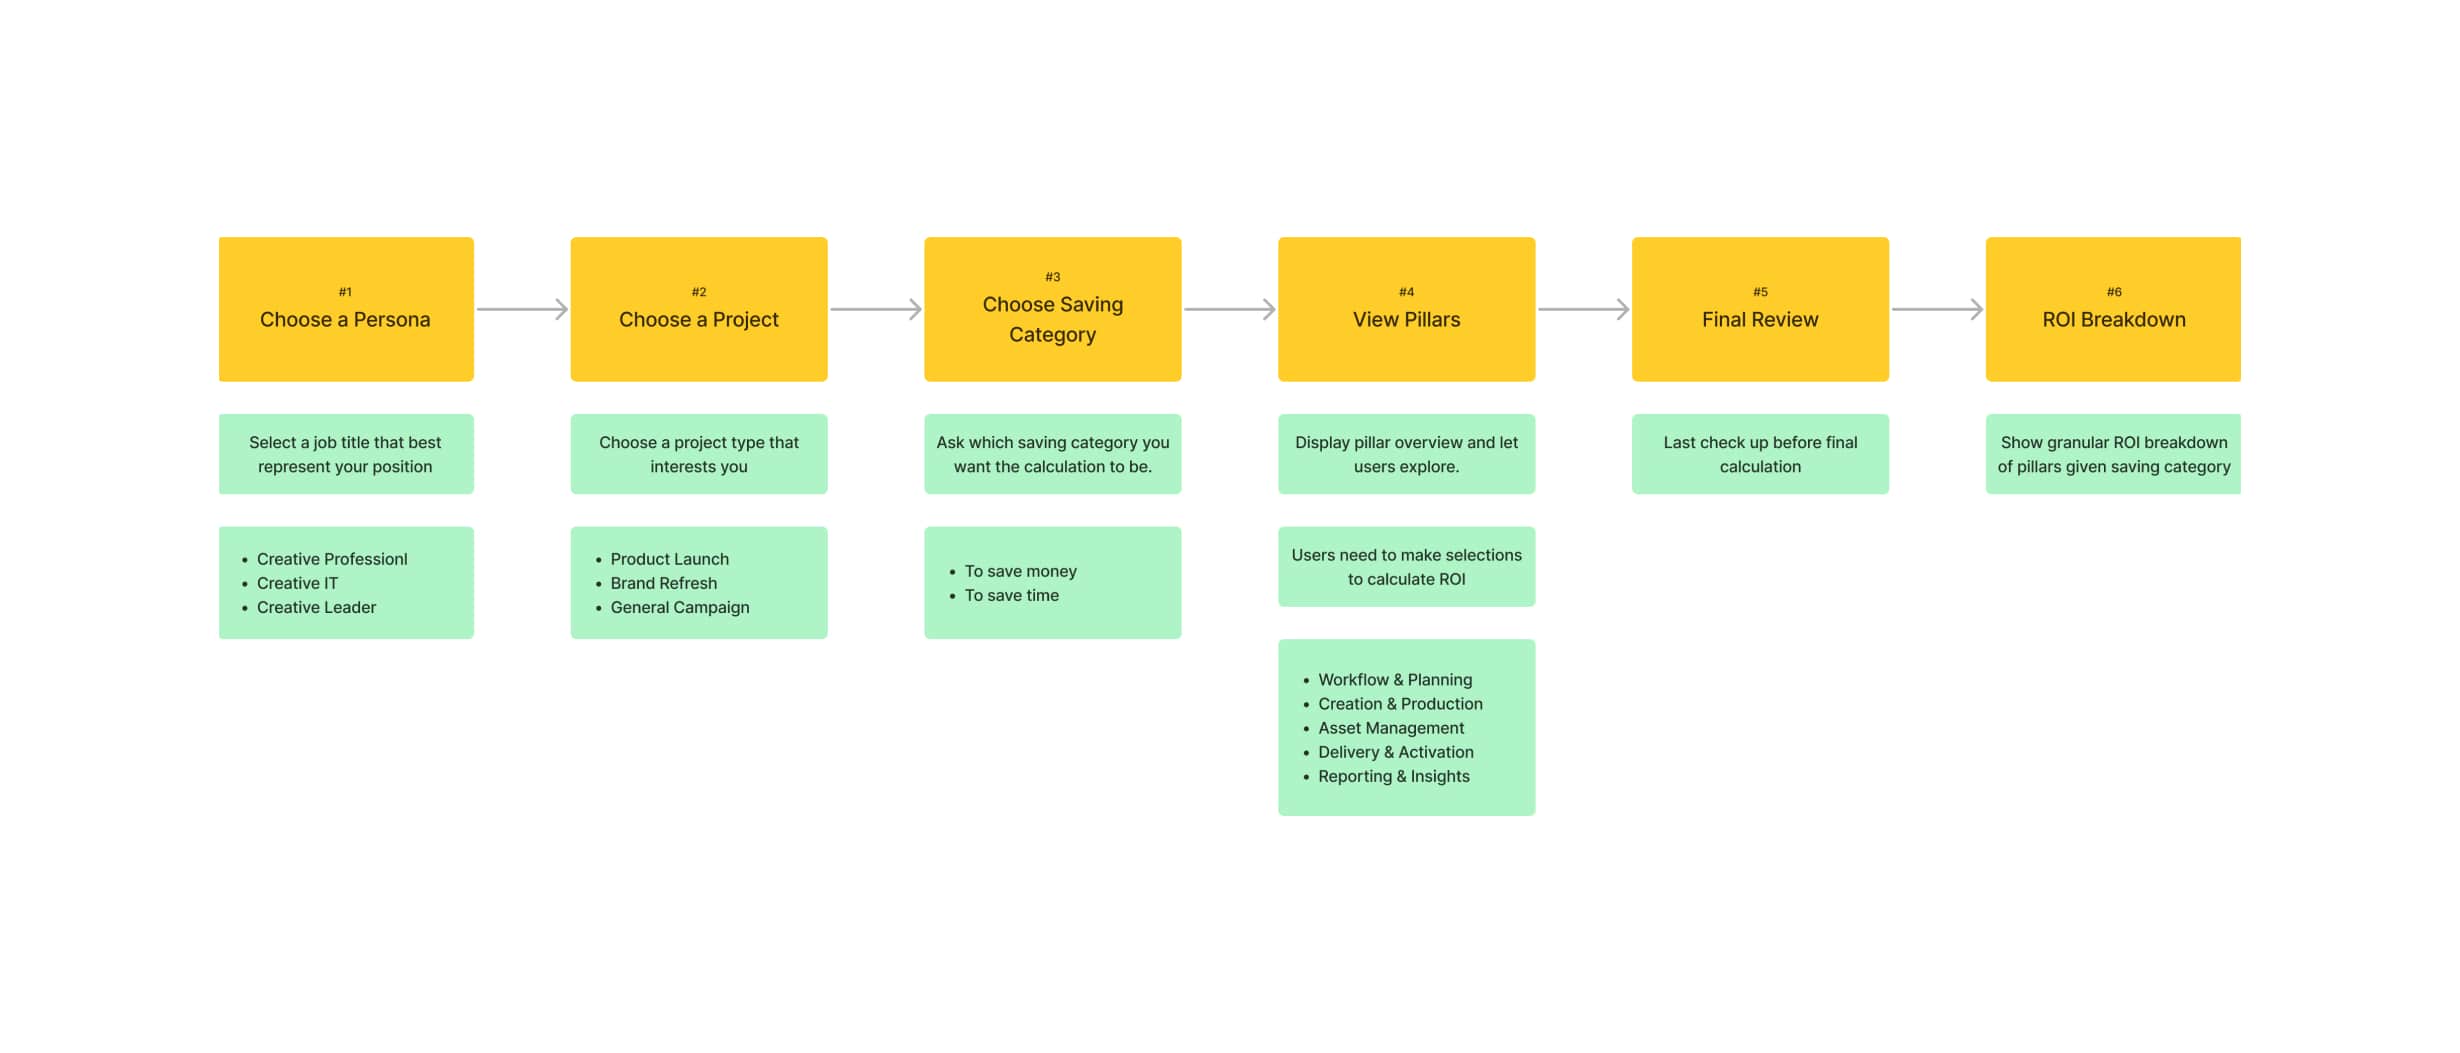
User Flow
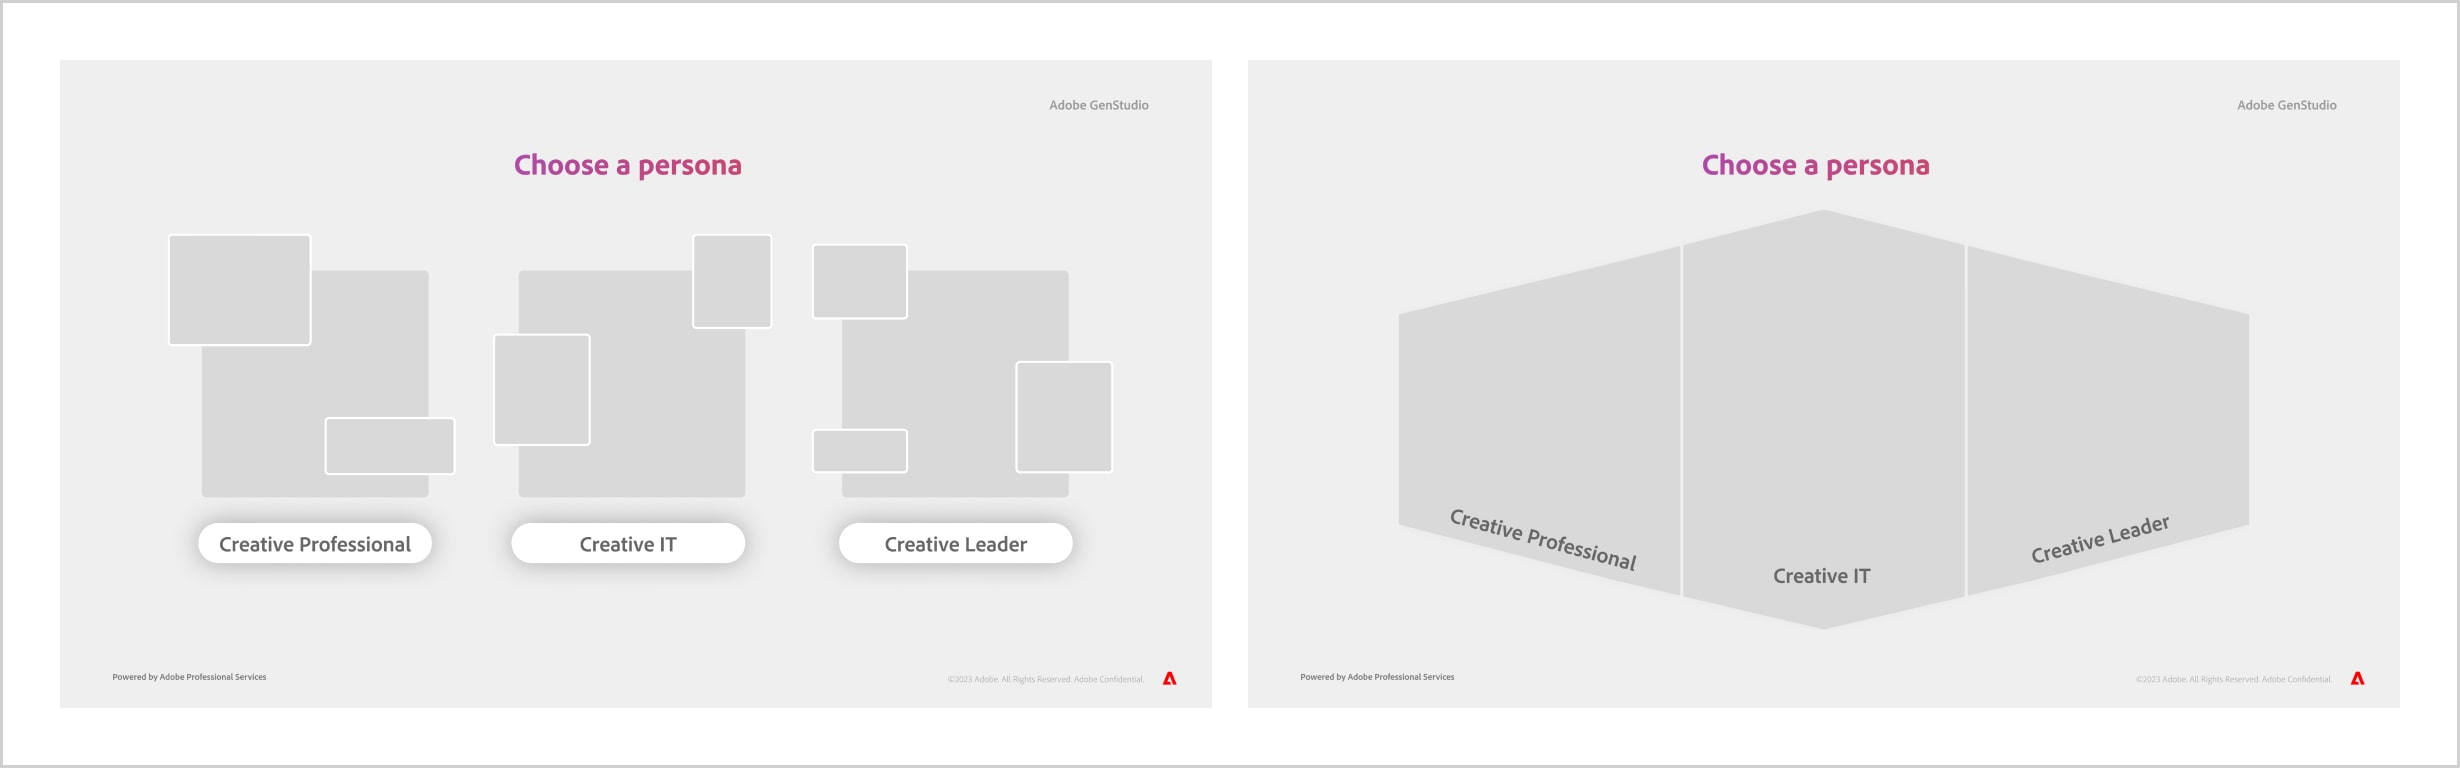
Ideation - Personal Selection
The experience kicked off by asking users to select a persona that best described their use cases. A couple of layouts and interactions were explored in the early design phase.
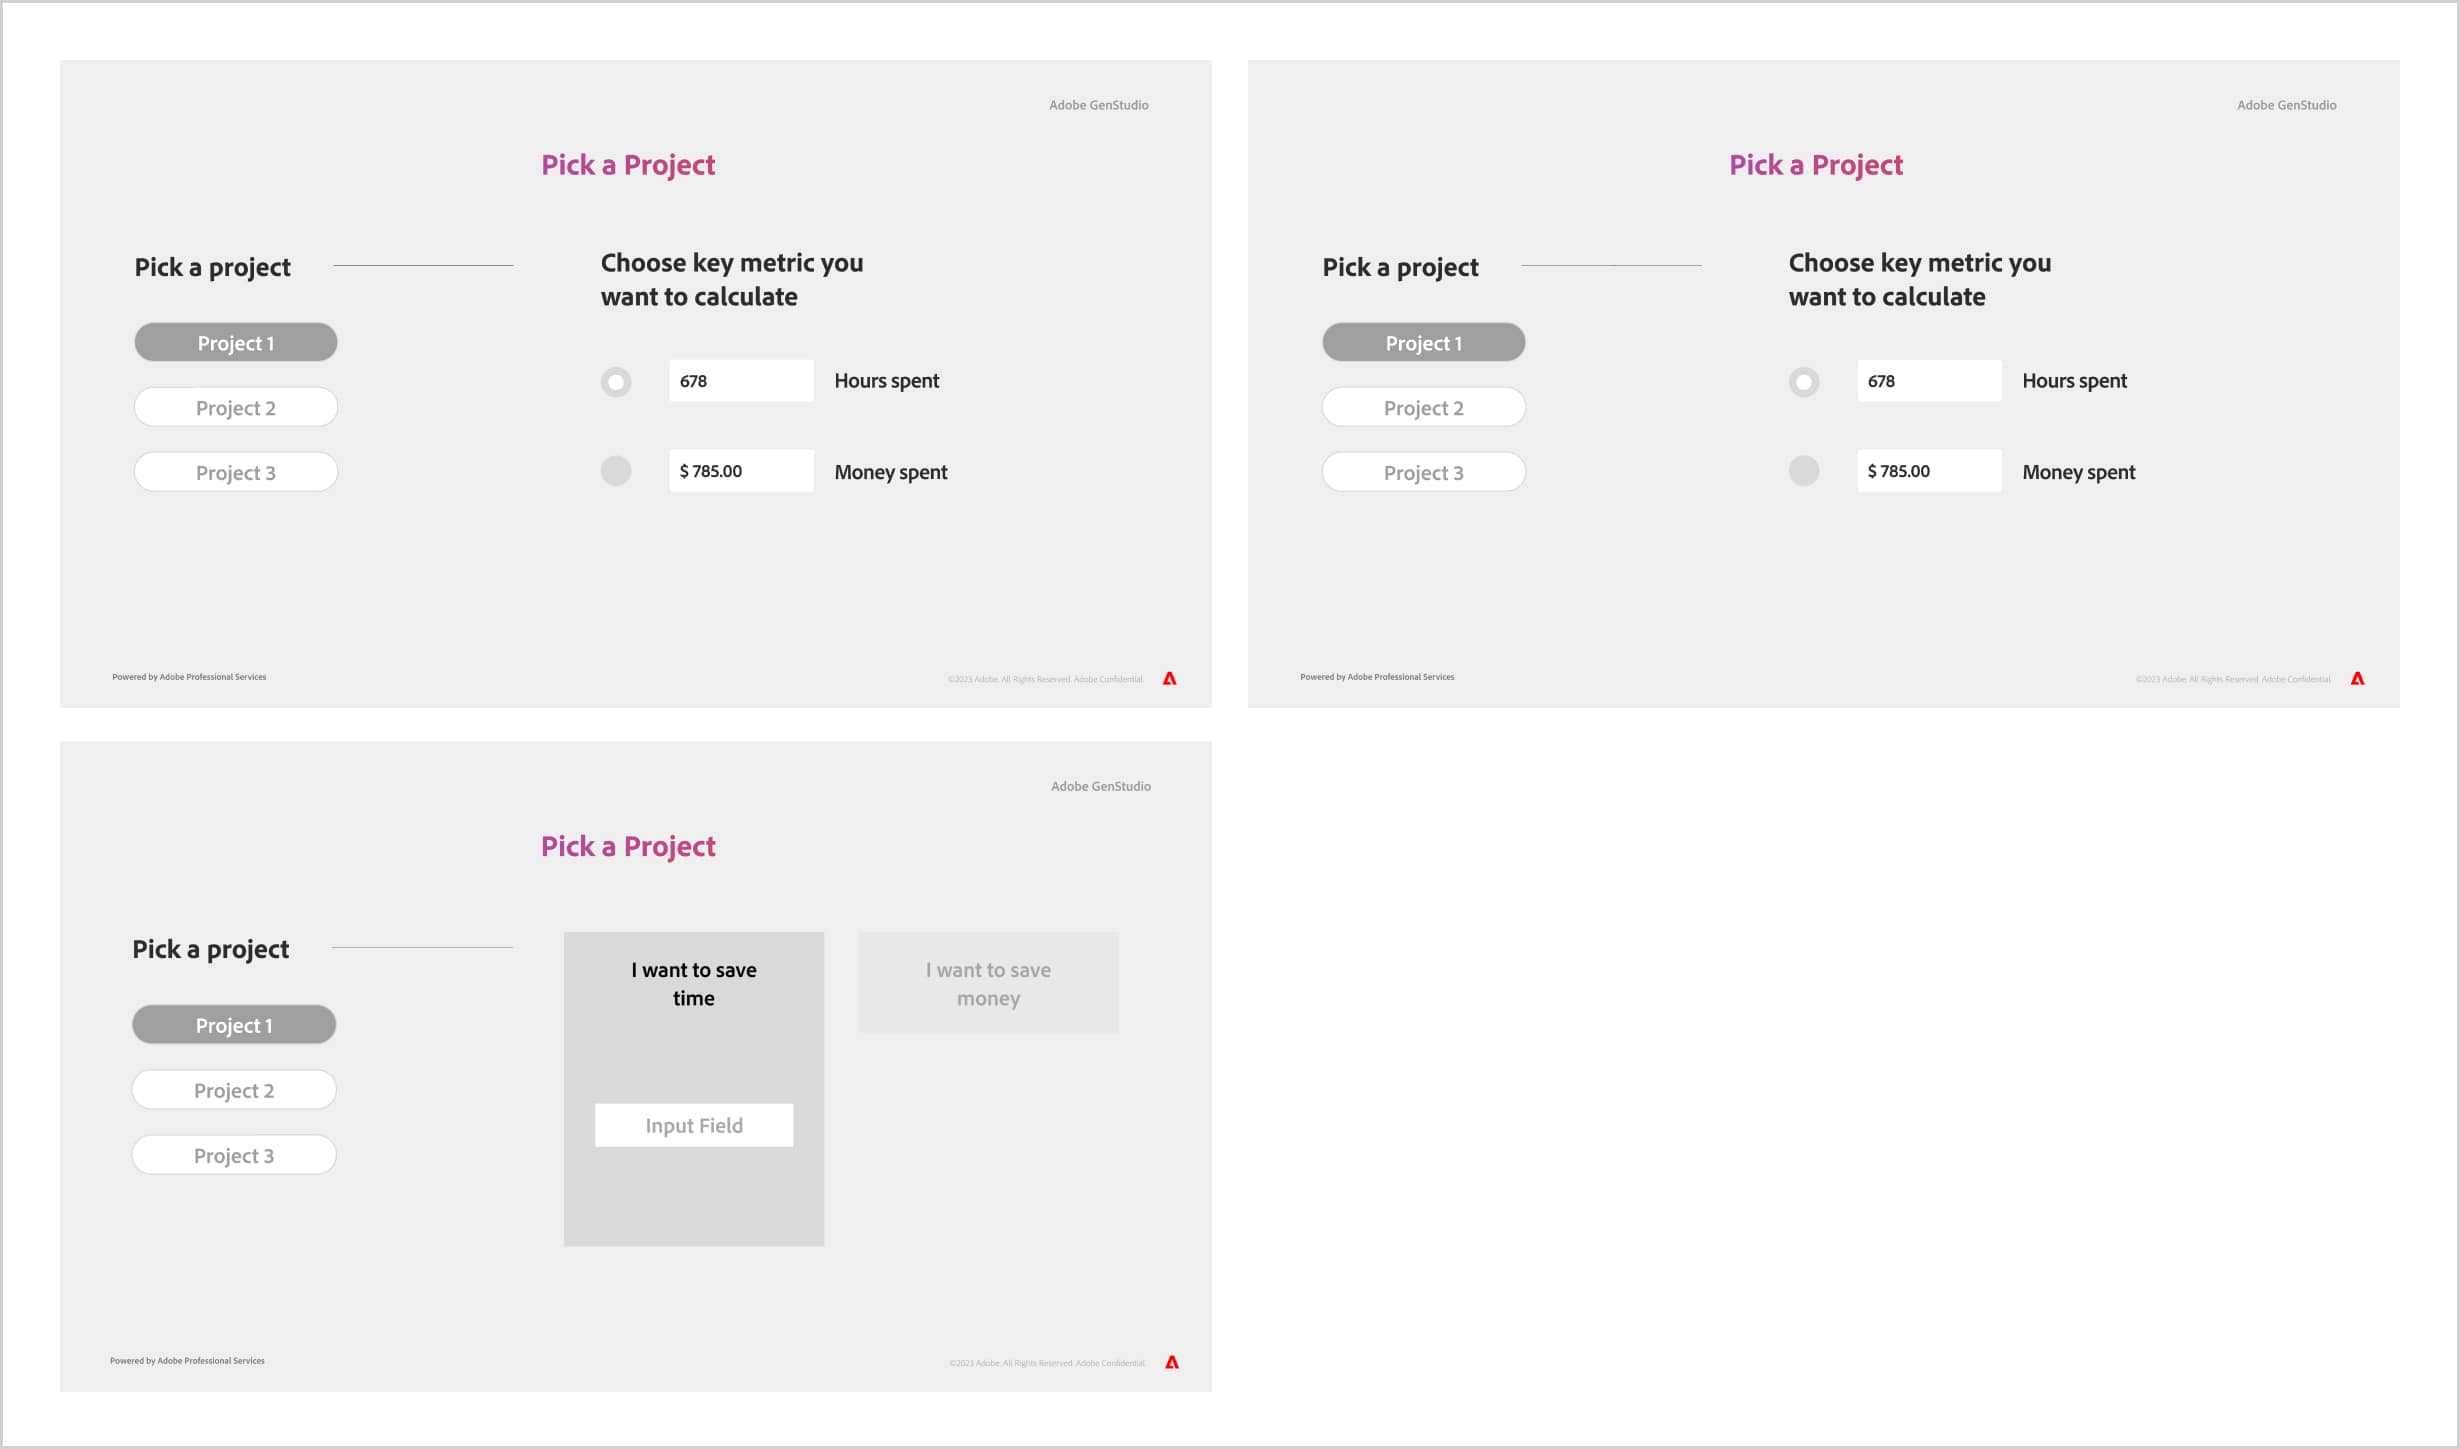
Ideation - Project & Saving Selection
The project manager and content manager suggested these two selections be interacted on one page for better user context. Different interactions were explored for users to choose either the money or the time category.
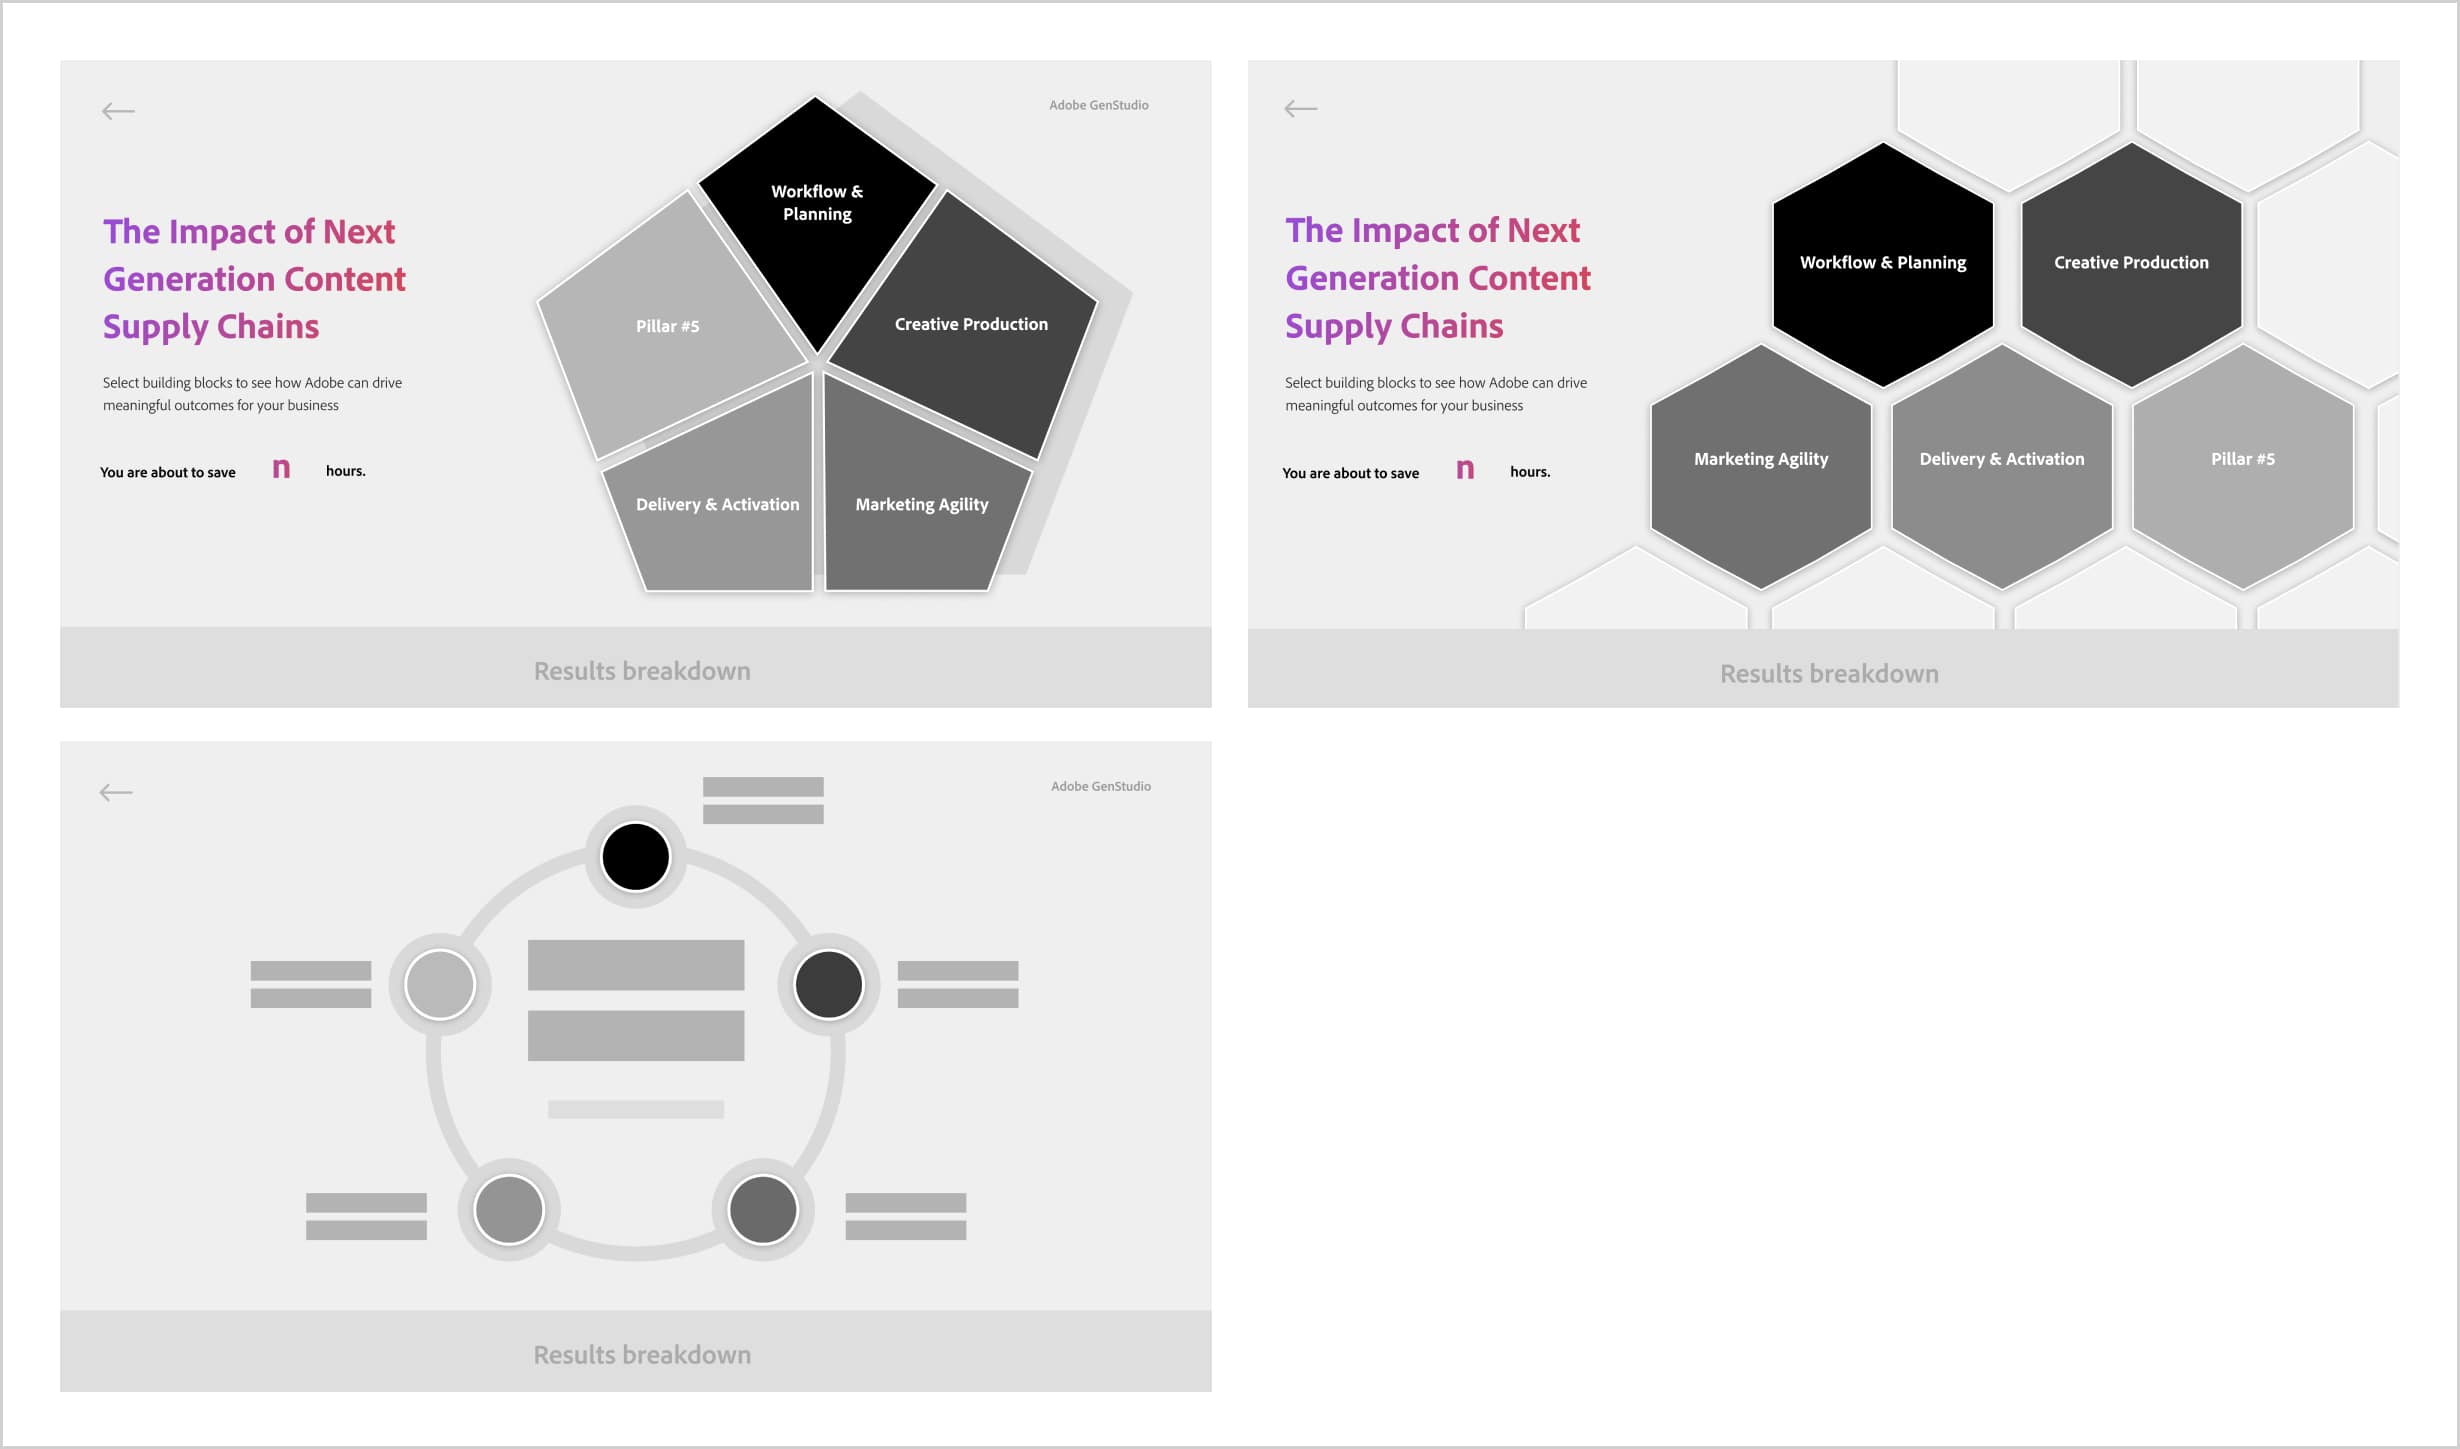
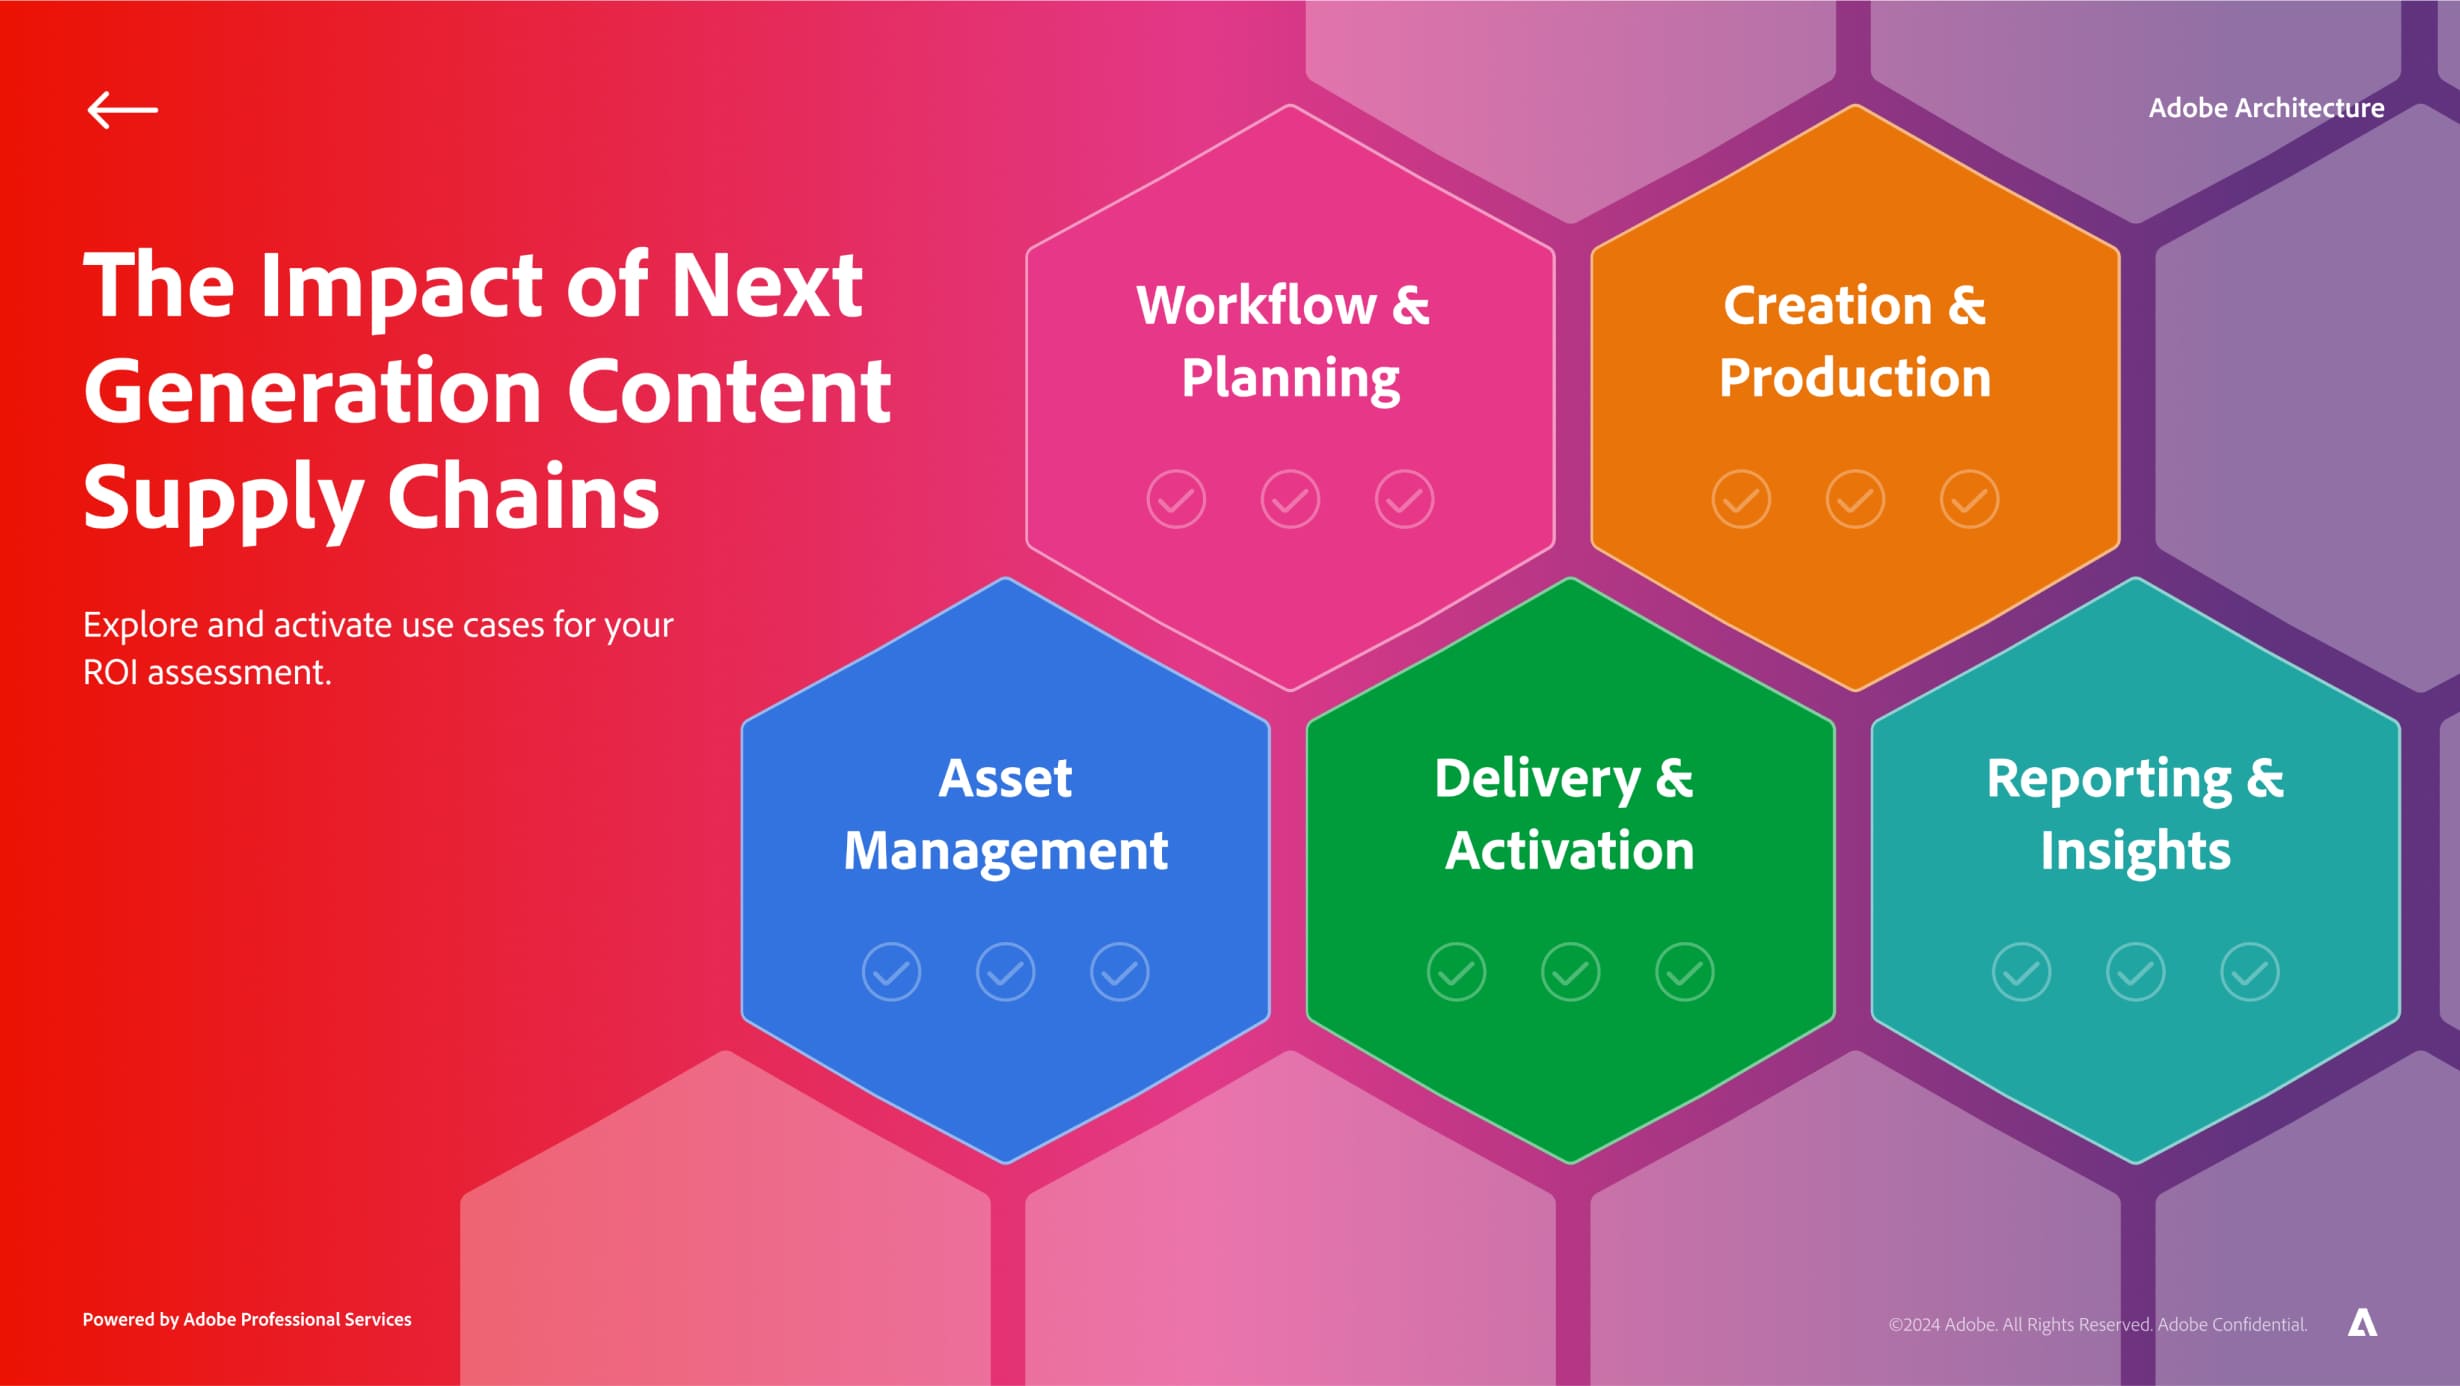
Ideation - Pillars Overview
The Pillars Page was the most important, it also contained the most information. The page served two purposes, to introduce features and for users to make ROI selections. Several layouts were explored to follow through with the hexagon theme.
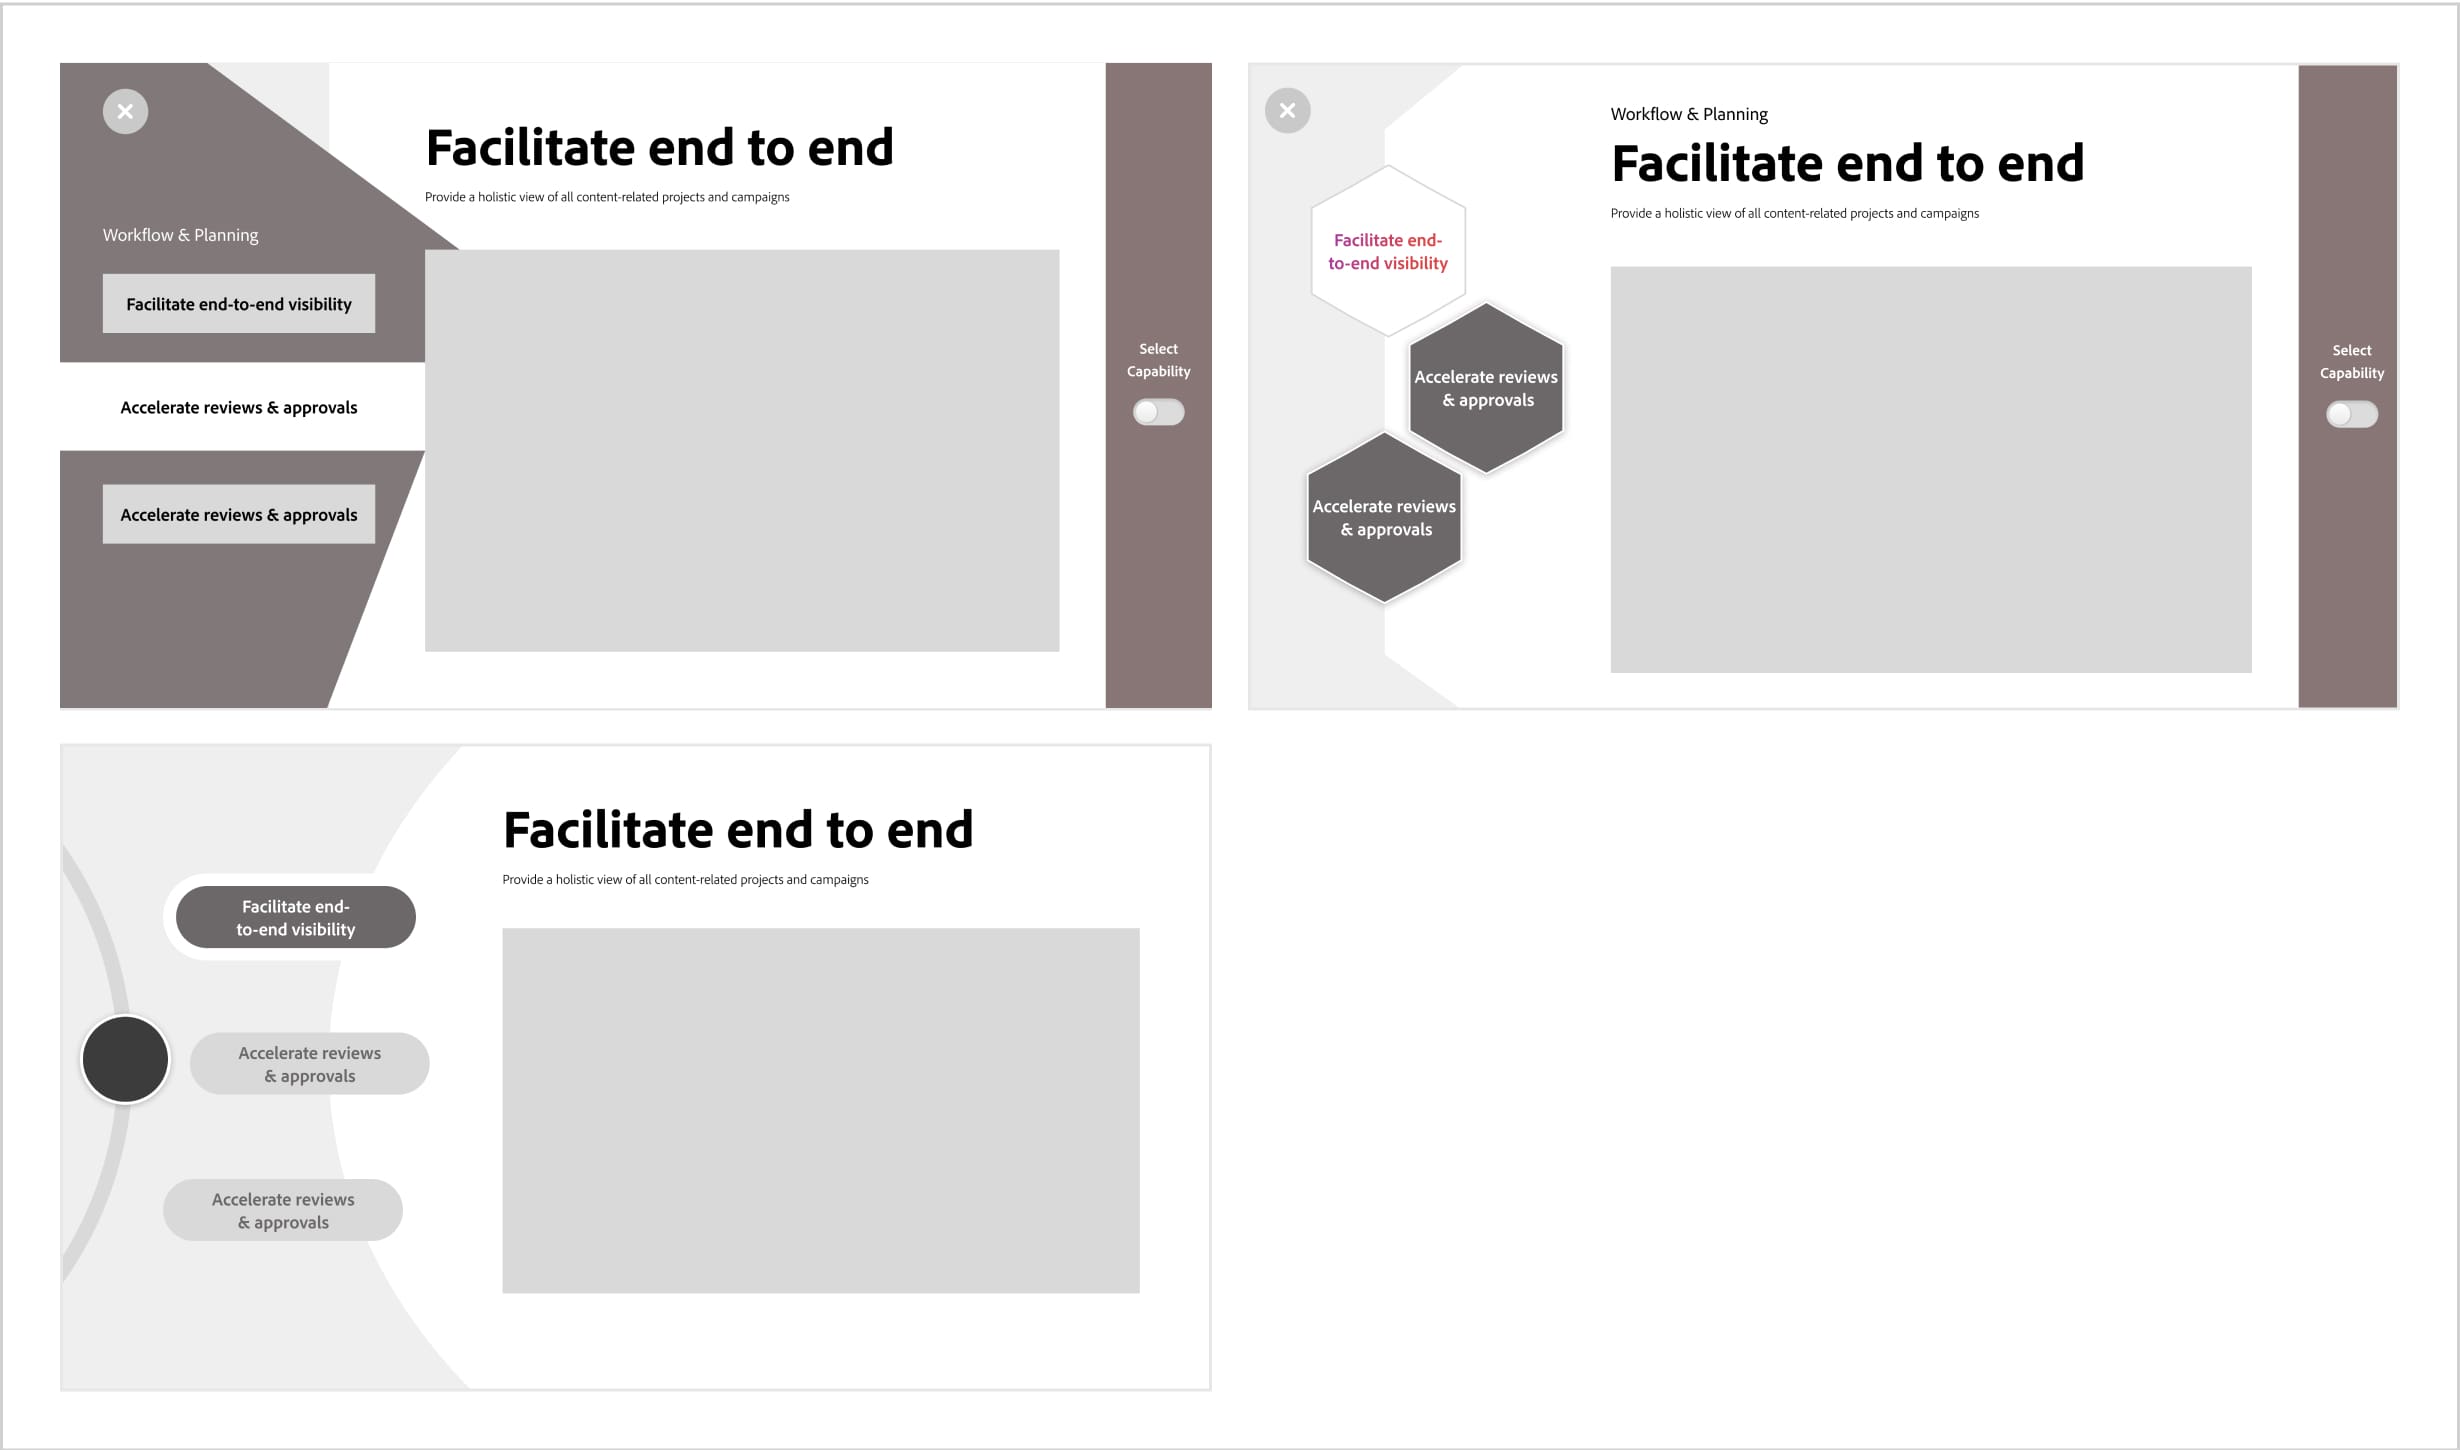
Ideation - Pillar Details
Different explorations to Pillar's details page. Users could pivot back and forth between different functionalities within a pillar and add functionalities to the ROI calculation.
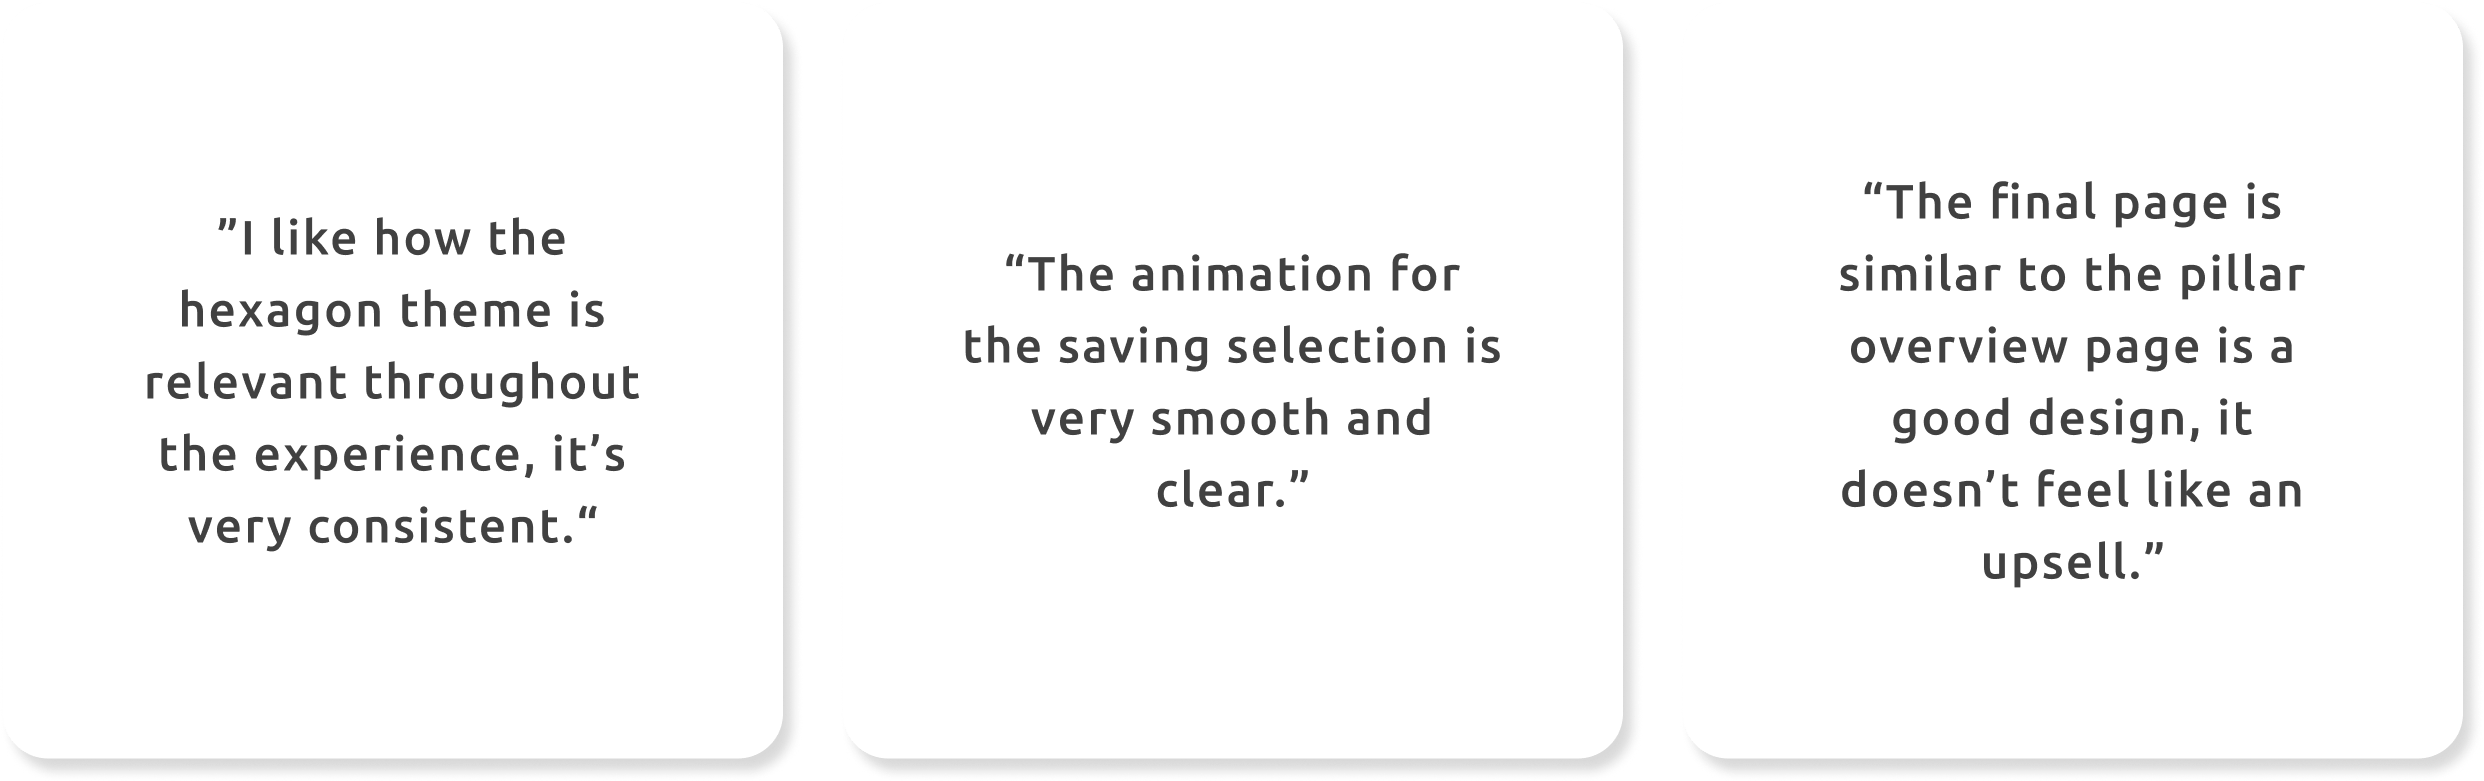
User Feedback
Data Performance
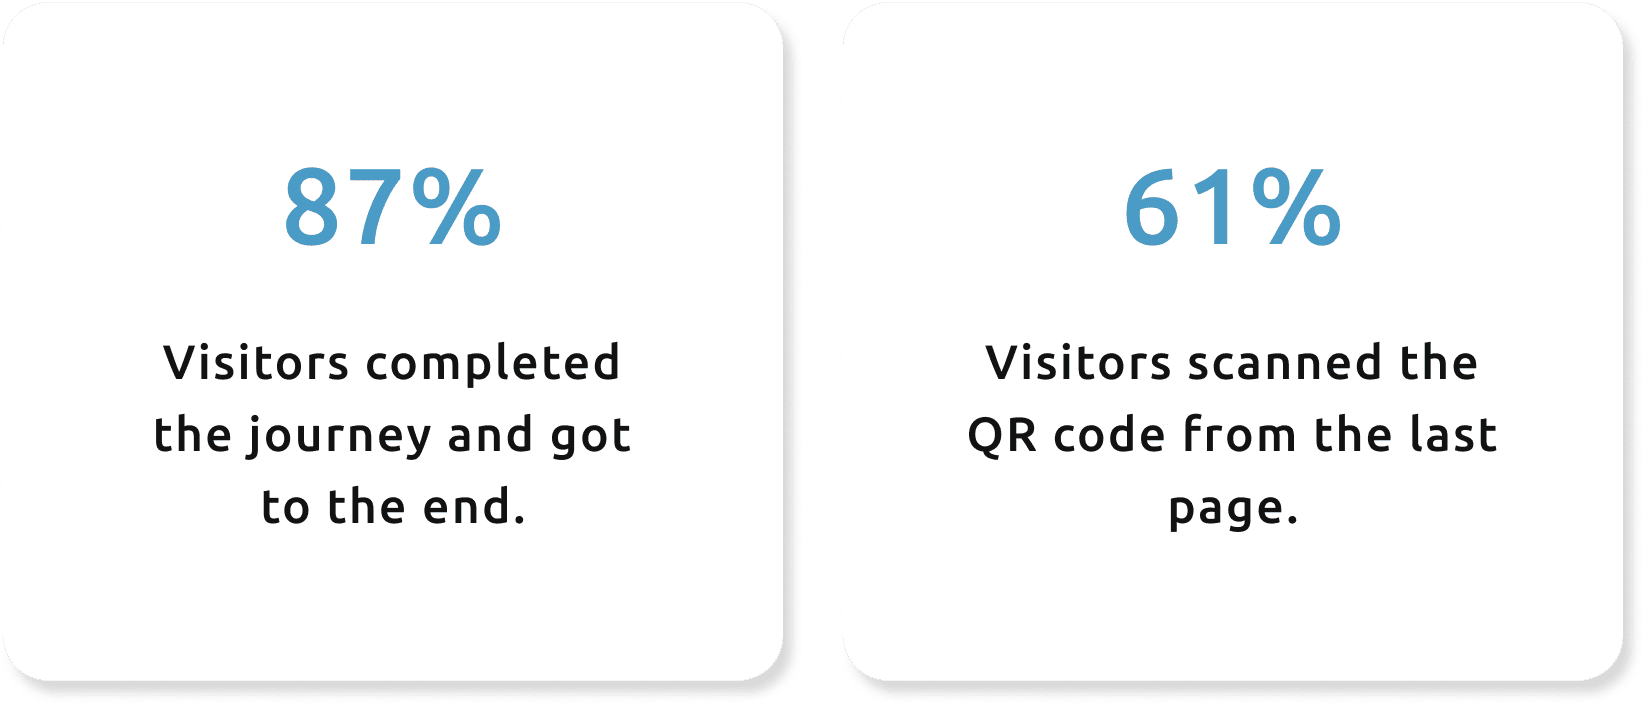
Conclusion
At the end of the event, data revealed that over 80% of visitors scanned the code. This success led Adobe to expand the interface experience globally by offering it in different languages. And sparked a second collaboration.